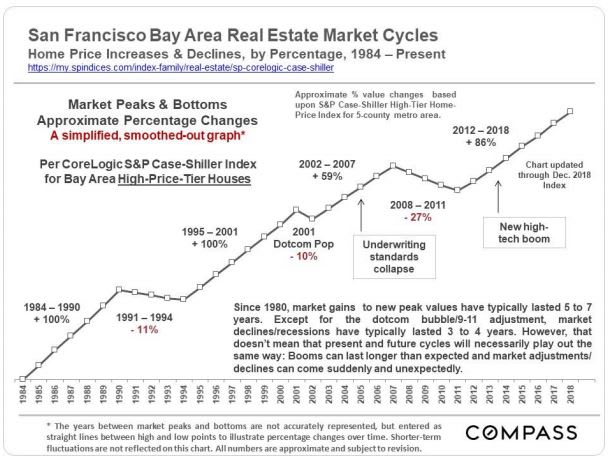
Regarding the chart above: The CoreLogic S&P Case-Shiller high-price-tier Home Price Index for the 5-county San Francisco Metro Area, illustrated above by the blue line, applies best to more expensive Bay Area housing markets such as most of San Francisco, Marin, San Mateo, and Diablo Valley/Lamorinda. The SF Metro low- and mid-price tiers had much more dramatic bubbles and crash in 2005-2011, but as of December 2017, have ended up at points a bit higher than the high-price tier. The green line tracks home price appreciation for the United States as a whole. The Case-Shiller Index is predicated on a January 2000 price of 100. “250” signifies a price that has appreciated 150% since January 2000.
S&P CoreLogic Case-Shiller Home Price Indices